You can look up the definition of a trend if you like. The trends I look at are collections of historical data points that are put on a linear graph. Trending data can provide insight to the efficiency of your operations. You can find the most basic information about trends on our Info-Portal here. In this article we will explore the analysis and benefits of a trend.
Analyzing pump performance with a trend
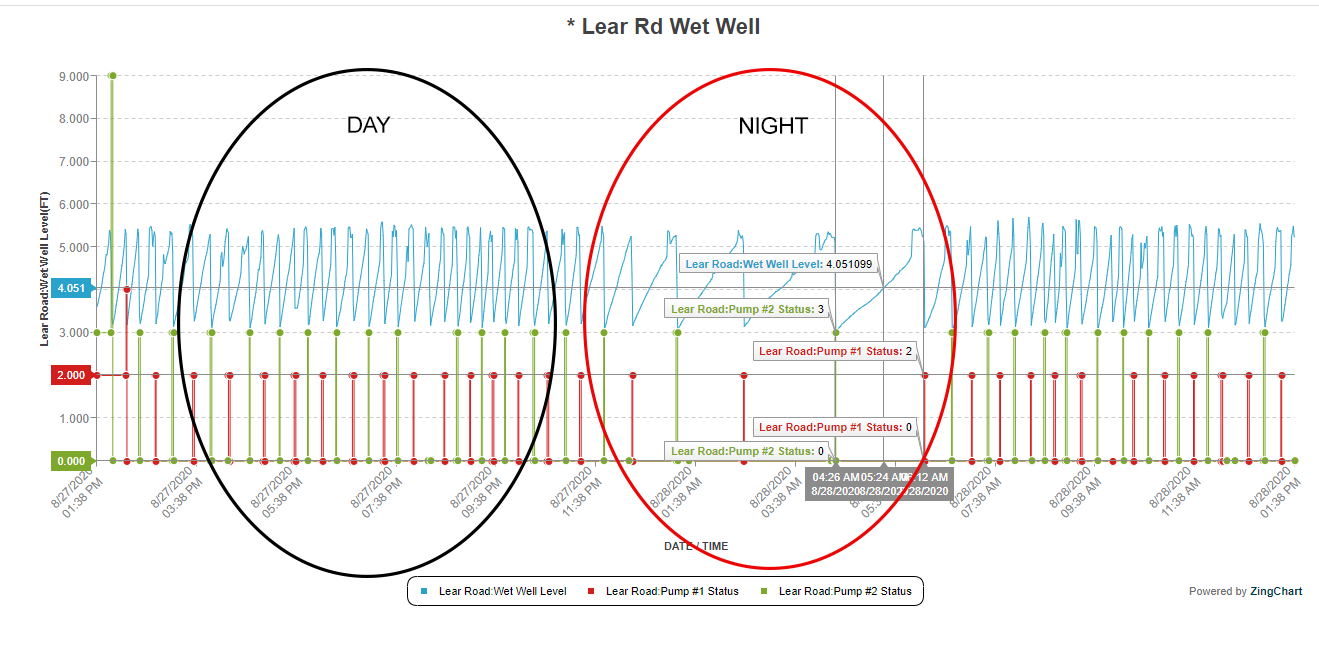
The graph below shows a lift station with 2 pumps. The red line for pump #1, and green for Pump #2. The blue line is the wet well level in feet. This chart shows a “trend” over a day.
During the day the pumps run about every 15-20 minutes. At night they only run every 2 – 2 ½ hours. Notice they are properly alternating and consistently drawing the wet well down.
Looking at the blue line in the NIGHT area (red circle) of the graph we can see that the down slope of the line is steeper than the upward slope. This tells us that the average time to empty the well is less than the average time to fill the well. The difference in slope angle shows the pumps have the capacity to handle the flow volume coming into the well. However, this line is not the most accurate indicator to tell us how effective the pumps are at handling the night and day volume coming into the well.
Benefits of analyzing a trend
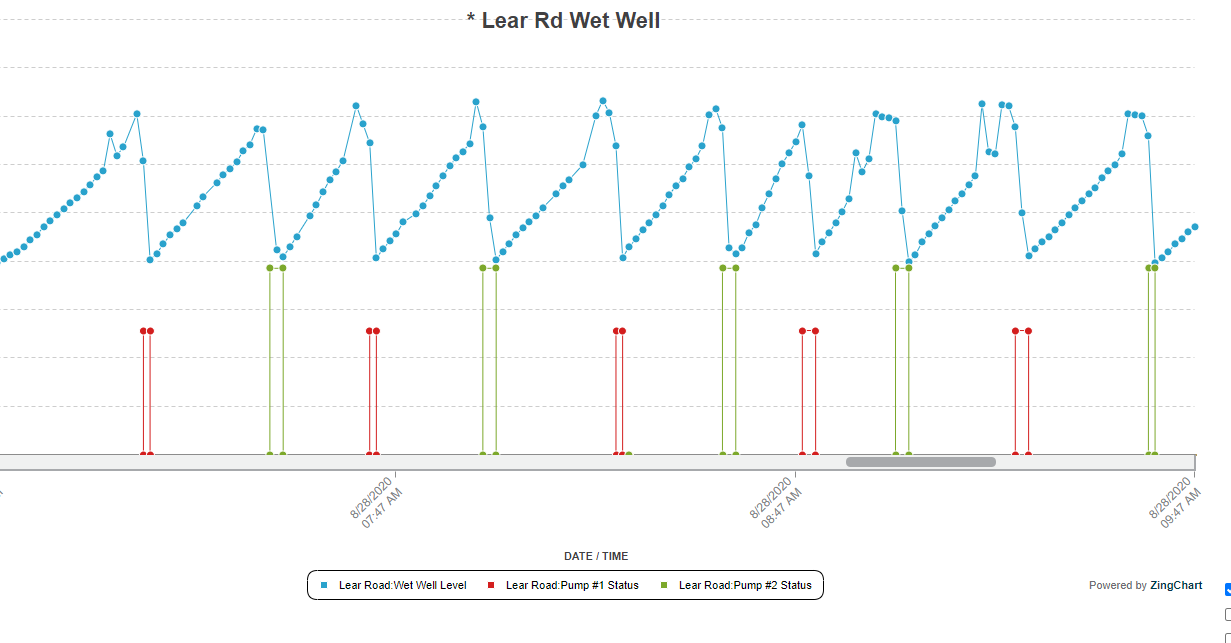
In the graph below, we can see that as we expand the view there are actually two lines for each pump. A line up for when the pump comes on and a return line down for when the pump turns off. The distance between the two tells us the amount of time each pump runs. Each time the pump turns on and off is one pump cycle. The accumulated time is known as Run Time Hours (RTH). This run time is the time it takes to empty the well. The time between each pump shutting off and the next time it comes on is the “crazy time” or “fill time.”
If the pump runs for two minutes and the time between “off” to “on” is 30 minutes during the day, the pump has an effective rating of about 93%. It takes the pump less than 7% of the level cycle time (empty-full-empty = 32 min.) to empty the well as opposed to the time the influent reaches the full level. At night we know that the pumps are more effective as the influent is dramatically less.
Trends analysis and benefits
Trend analysis and benefits
If we were to follow this same graph for a period of years, we would see that the run times increase. This tells us that pumps become less efficient the longer they are in use.
Trending does not tell us about uncontrollable circumstances, but the controllable. This is because trending is not a proactive maintenance solution for root causes. They will not show obstructions to the pumps or discharge lines. Trending can point us to important changes over time and to what rate these changes take place. Indicators such as the RTH, and pump cycles, can help set targets to make interventions. In other words, proper analysis of a trend can provide serious benefits.
This is off canvas menu widget area. To enable it add some widgets into Appearance – Widgets – Menu Section, and go to Customizer – Main menu to set the icon position.