Trends, Displays and Reports the Way You Want Them
Now that you have all the information you need to make good decisions, Data-Command pulls it all together in one secure platform. You can securely log into our Info-Portal from wherever you are, whenever you want. Once logged in you will see your information on customized displays. Additionally, you can generate customized reports and see trends.
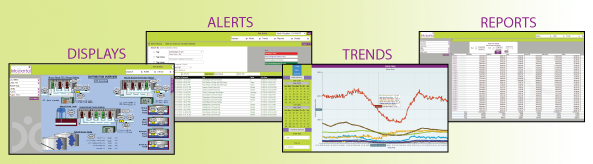
Features offered include Displays, Alerts, Trends and Reports
·Customized displays – View equipment information in displays that mimic your unique processes and plant layouts.
·View trends and reports – Create trends that analyze system data history and run fast, customized reports to track specific information and troubleshoot. All reports can be downloaded or printed for further analysis.
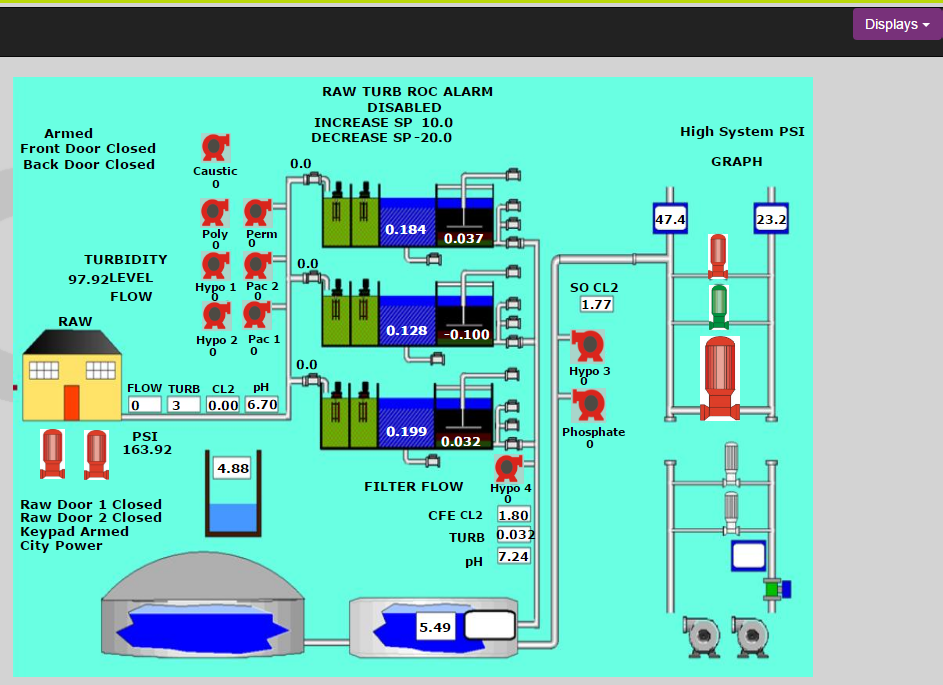
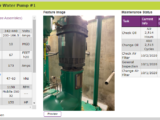
Displays
As a standalone, SCADA provides up to date information in a user friendly and easy to read format, and so does Data-Command. Create as many displays as you want and customize them to your needs. Upload any standard format of pictures (.jpg, .png, .gif, etc). These images can be pictures of your equipment, cartoons of a pump or tank, or anything that makes sense to you. Attach them to a display object and dynamic tag from your equipment to get animation, or simply use a static image.
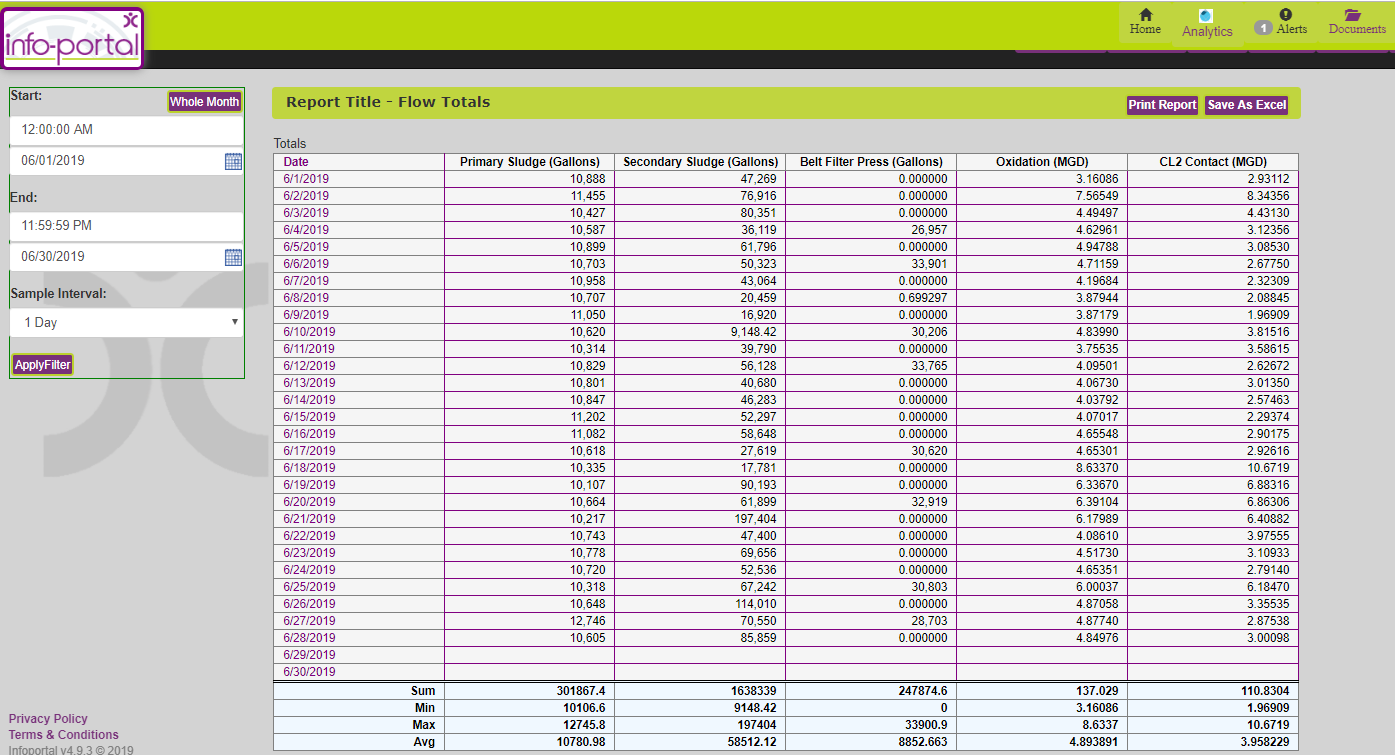
Reports
Data-Command provides previous and current data that is easily accessible. Reports can be customized to show specific data at a glance. Effortlessly adjust the date, duration, and interval to create the report you require. Track any information you need about run times, wet well levels, rainfall, steam usage, and more. Practically any function your facility performs can generate a report to help you monitor operations.
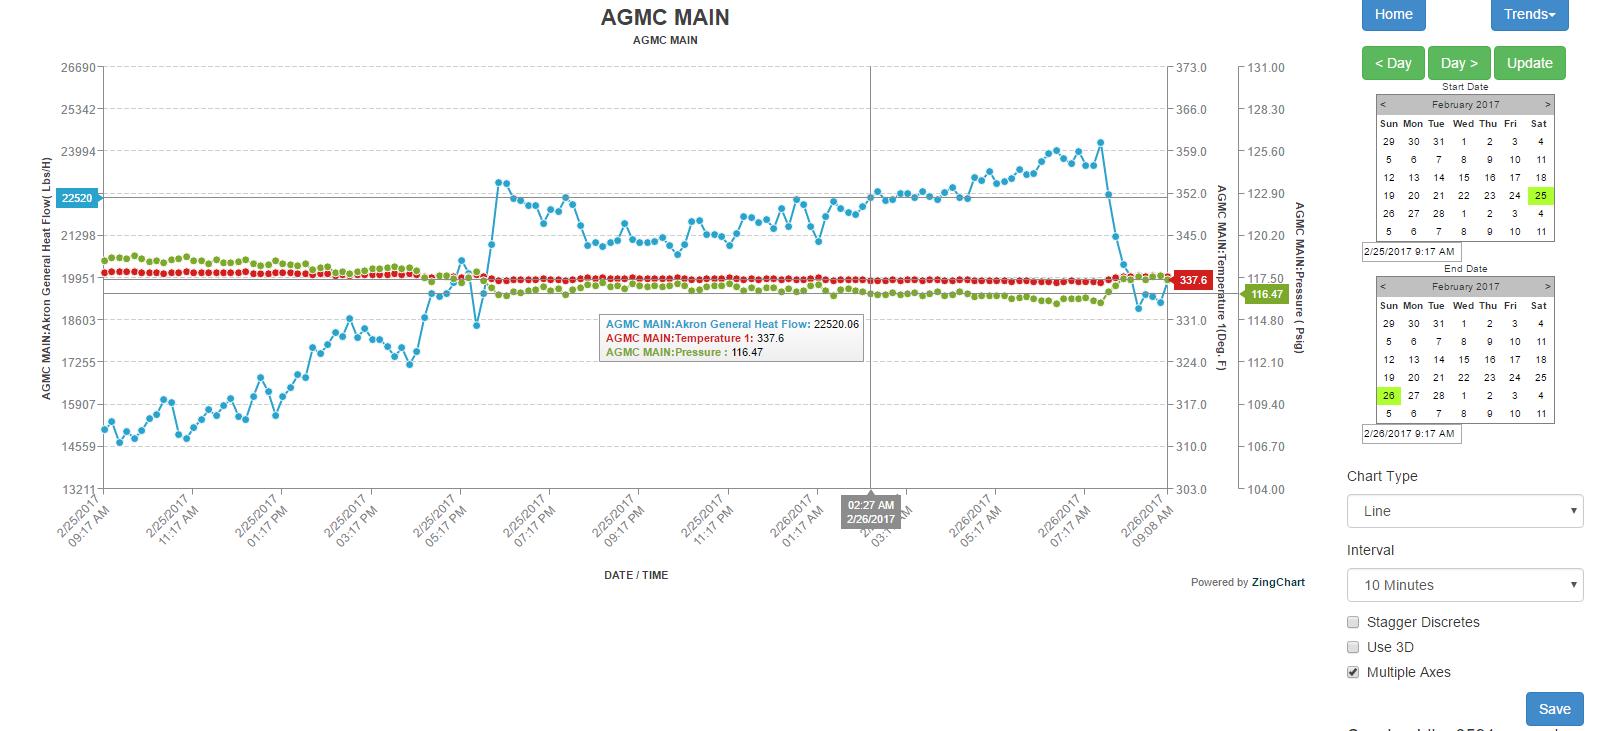
Trends
Without being able to see what has happened in the recent past, it is very difficult to troubleshoot an issue. Like standalone SCADA packages, we have a full trending package for looking at data history. You can create as many trends as you like, give them descriptive names, and connect corresponding information on each trend. There are several types of trend displays available, such as line graphs and column charts. When you configure the time span and interval that you normally want to see, every time you click on that chart it is displayed just the way you want. Individual pen colors distinguish data. You can zoom in and out, and scroll across your data to see specific times and values.
This is off canvas menu widget area. To enable it add some widgets into Appearance – Widgets – Menu Section, and go to Customizer – Main menu to set the icon position.